OUR SERVICES
Analytics and Reporting
Analytics and Reporting

About Our Services
With our support, you can harness the power of data to make informed decisions, enhance learning experiences, and drive continuous improvement.
Reporting
We use, process, and visualize your data to uncover trends, patterns, and correlations, delivering detailed reports that make it easy to monitor progress and pinpoint areas for improvement. With objective measurement, analysis, and actionable feedback, you can streamline efforts to optimize outcomes.
Analyzing
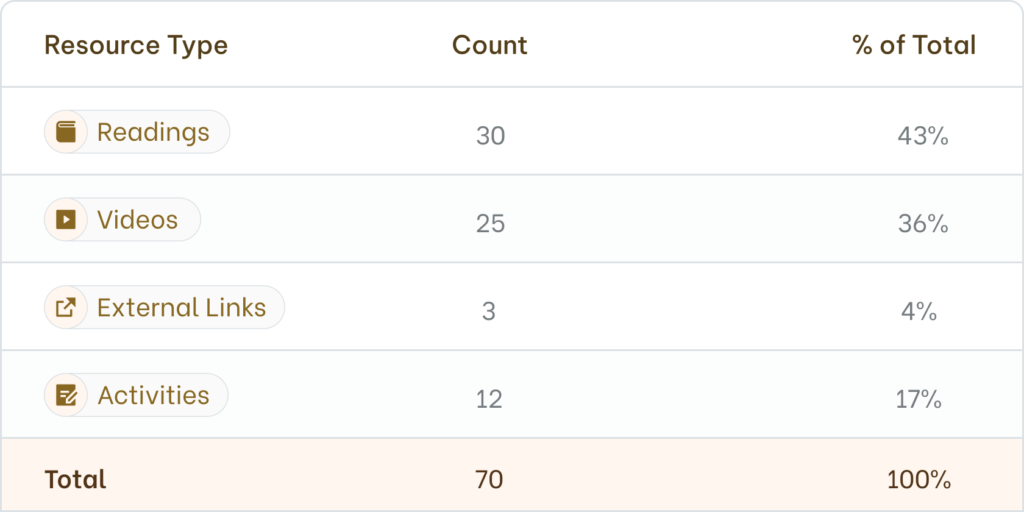
Each course may include over 100 resources, requiring a robust system to classify and measure their usage. Our analytics provide in-depth insights into key areas, from ensuring content variety to maintain learner engagement to verifying compliance with internal and external standards for online learning.
Frequently Asked Questions
Is it possible to measure course effectiveness?
If the client provides data in compliance with PII (Personally Identifiable Information) related regulations, we can track resource usage, learner engagement metrics, assessment performance and accessibility compliance to help pinpoint gaps, highlight trends, and offer actionable insights.
How are analytics findings delivered to stakeholders?
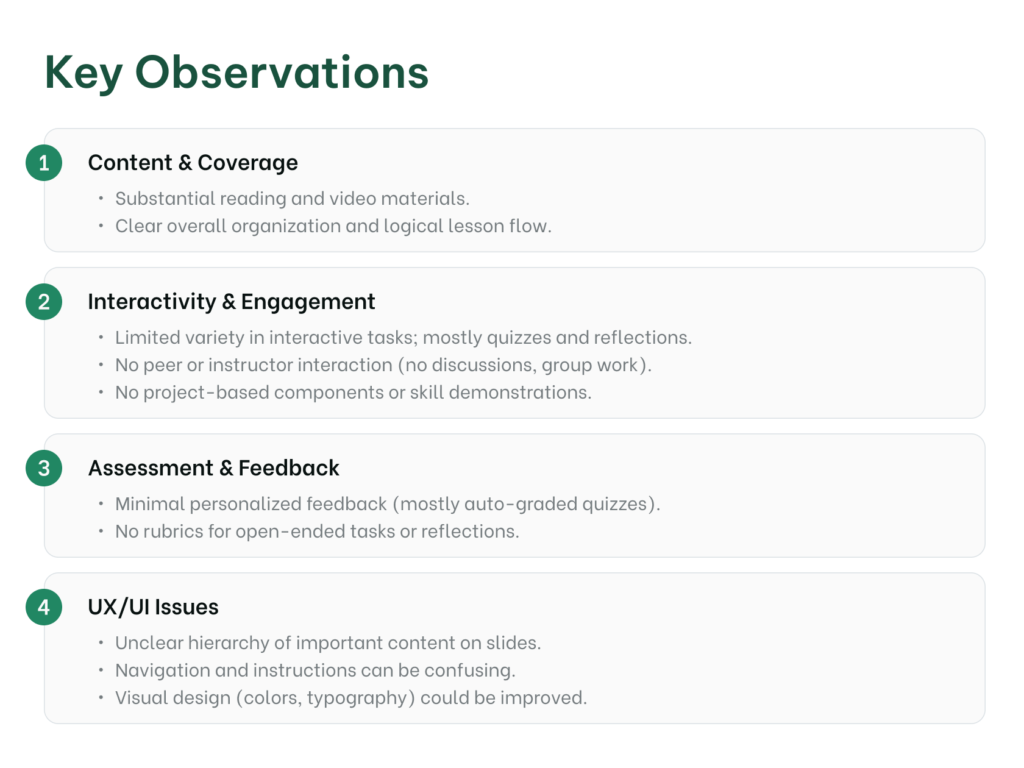
We provide clear, detailed reports that visualize key indicators, such as course completion rates and alignment with learning outcomes. These reports make it easy to spot improvement opportunities and celebrate successes.
Can analytics help ensure compliance with program goals and external regulations?
Absolutely. We measure alignment with institutional standards, RSI (Regular and Substantive Interaction) requirements, and accessibility guidelines. This data-driven approach identifies compliance gaps so they can be promptly addressed.
Do your reports include recommendations for course or program improvement?
Yes. Alongside raw data and visualizations, we provide expert interpretations and practical recommendations. These may include refinements to lesson pacing, additional resources for high need areas, or enhancements in assessment design.
Is ongoing analytics support available for continuous improvement?
Yes. We can provide either one-time reports or ongoing analytics support to help you track progress over multiple semesters or iterations, ensuring your courses remain relevant and effective in the long run.
Learn About Other NovEduca Services
Content and Curriculum Development
Captivating learning environments and customized resources to increase student engagement and help achieve learning outcomes.
Learn More
Project Management
Collaborative planning, execution, and monitoring for on-time and on-budget results.
Learn More
Learning Experience Design
User-centered visually appealing educational experiences designed to reach your program goals and fulfill your learners’ needs.
Learn More